Metallographic
Atlas - example pages from the printed version
1b. Etching methods, cont'd

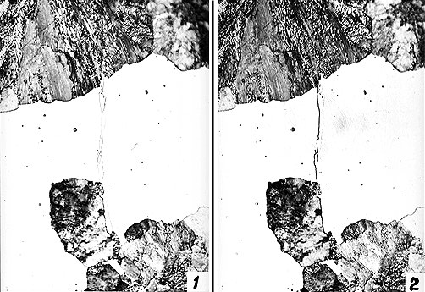
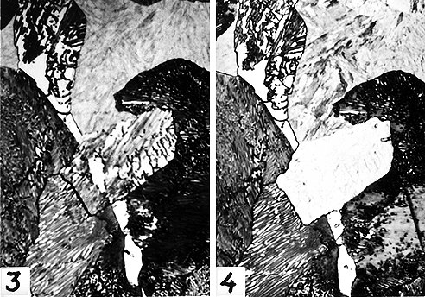
Micrograph 1 (and 2). Most etching reagents attack different phases with different rates and sharp steps will form at the phase boundaries. In the microscope they will show up as black lines. This micrograph is taken on an Fe-C alloy containing martensite, ferrite and cementite. Martensite is big white areas. A thin band of white ferrite is shown vertically. It has been attacked more than the martensite and is thus at a lower level. Thus the black contours. Cementite is found in a fine mixture with ferrite (so-called pearlite). Cementite is not at all attacked and should thus look white, also, but it is standing above the ferrite, which was attacked. The pearlite areas thus appear black when the lines cannot be resolved.
Micrograph 2. This micrograph is taken on the same area as picture 1 but with oblique illumination coming from the left. It is thus easy to see that the band of ferrite has been attacked more than the martensite.

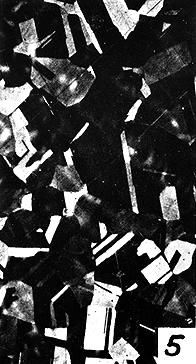
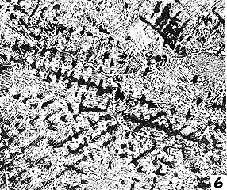
Micrograph 3 (and 4). This micrograph is similar to picture 2 but the etching was heavier and the martensite has thus been attacked and looks grey with a diffuse pattern in it.
Micrograph 4. The etching reagent may be so sensitive to the orientation of a crystal that some crystals are hardly attacked at all. This is the case for so-called nital (1 % HNO3 in alcohol) on {100} surfaces of bcc Fe (ferrite). The white area in the center is a grain of ferrite of this orientation and comparison with picture 3 reveals that it is a small proeutectoid particle of ferrite which has later developed into pearlite by collaborating with cementite on its continued growth.

Micrograph 5. Many etching reagents are sensitive to orientation as well as composition. This micrograph is taken on a single-phase fcc Cu alloy produced by casting. One can see annealing twins due to the effect of orientation. The material has thus been deformed and annealed after casting. One can also see an effect of an uneven distribution of alloying elements. This is a memory of segregation occurring during solidification. The annealing has thus been too short to completely even out composition differences by diffusion.

Micrograph 6. One can apply different etching reagents one after the other and thus get different etching effects overlapping. This specimen of a low-carbon steel was first etched in nital to show ferrite(white) and pearlite(thin black regions). Then it was etched in a special reagent (Oberhoffer's etch) in order to reveal the distribution of P, present as an impurity. A dark reaction product then deposited on the areas of low P content (large black regions). It shows that P has segregated strongly during solidification. Black areas reveal the dendritic pattern of solidification. It is evident that this steel has not been deformed mechanically. The shape of the black areas shows that they represent the first, thin skeleton of dendrites. It is evident that P has had the tendency to remain in the melt, leaving the first solid to form without much P.
Last change: 19 of Dec 1996
Lars Fredrik Larsson
larsf@matsc.kth.se 


